
 Michael D. Morse
Research Accomplishments, Activities, and Future Directions
I. Research Objectives
Research in my group centers on the elucidation of the electronic structure and chemical bonding of small neutral and cationic metal clusters, semiconductor clusters, and unsaturated metal-ligand complexes via electronic spectroscopy. We employ a wide range of technologies from lasers to mass spectrometers to extract the information we seek. With these tools we work to understand the chemical bonding in these systems and to identify the determinants of molecular structure and reactivity, particularly in the complicated transition metal systems. This work provides detailed and fundamental knowledge about the inner workings of matter on a small scale that can help human kind better understand processes as seemingly diverse as the catalytic production of major industrial materials and the detection of molecules in interstellar space.
II. Research Methods
There are three instruments in my research group: a resonant two-photon ionization (R2PI) spectrometer, a combined resonant two-photon ionization/dispersed fluorescence (R2PI/DF) spectrometer, and a cryo-cooled ion photodissociation spectrometer that is currently under construction. These three instruments all use the same source to create a molecular beam of reactive molecules, but then interrogate them in complementary ways. Click on the topic of interest below to learn more about that instrument.
Resonant Two-Photon Ionization (R2PI) Spectrometer
Dispersed Fluorescence (DF) Spectrometer
The Cryo-cooled Ion Photodissociation Spectrometer
III. Research Accomplishments
First Measurements of Bond Lengths
Accurate Measurements of Bond Dissociation Energies
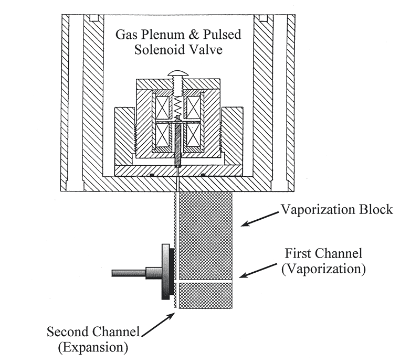
Molecular Beam Source
All of our instruments use a pulsed laser to vaporize a metal target. Vaporization involves the deposition of approximately 10 mJ of tightly focused laser energy onto the metal sample in just 10 ns to generate an extremely hot plasma (about 10,000 K). The resultant plasma and all its contents (metal atoms, metal ions, and electrons) are then swept into the vacuum chamber by high pressure helium (1-10 atm) that is flowing over the metal target at the same time. In our source chamber, the expansion into vacuum occurs through an orifice with a diameter (2 mm) that is much larger than the mean free path (5 nm) of the gas expanding through it. What this means is that the contents of the expansion undergo numerous collisions upon exiting the high pressure region over the metal sample. This type of expansion is called a supersonic expansion because the ultimate speed attained by the particles in the beam is much greater than the local speed of sound, which drops to very low values as the gas expands and cools. What is important to us is the fact that the large number of collisions upon expansion serve to cool the contents of the beam electronically, vibrationally, and rotationally. Typically, vibrational motions are cooled to 50-100 K and rotational motions to 5 K. This greatly simplifies the spectra we observe. The simplification results from the fact that all the molecules are in just a few quantum states. The only transitions that can be observed originate from these few populated levels. Some of the molecules we have studied would absorb light everywhere (and their spectra would be absolutely uninterpretable!) if it weren't for supersonic cooling.
In most of my past work, the expansion gas was helium or argon. In more recent work, however, we have been seeding our expansion with small amounts of other gases, such as CH4, C2H2, NH3, SiH4, H2S, H2Se, etc. The extreme conditions of the plasma allow the reactant gases to break apart into atoms or radical fragments that then react with the metal atoms in the plasma. The result of this plasma chemistry has been an array of new molecules that I describe in the next few sections.
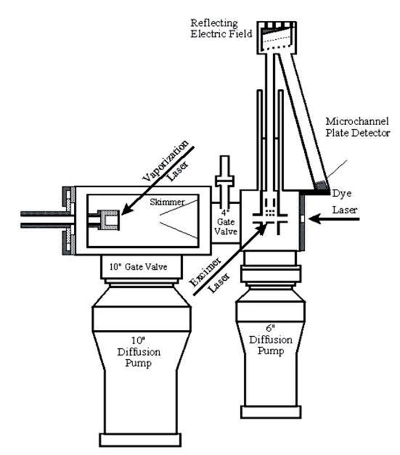
Resonant Two-Photon Ionization (R2PI) Spectrometer
In this instrument, molecules produced in the molecular beam are sent into a time-of-flight (TOF) mass spectrometer that is housed in a high vacuum chamber attached to the source chamber. In the most typical arrangement for this experiment, we direct the output of a tunable laser down the axis of the molecular beam to excite the molecules, and then expose the molecules (20 ns or so later) to the ultraviolet radiation produced by an excimer laser, by the 4th or 5th harmonic of a Nd:YAG laser, or by a frequency-doubled OPO laser. In all cases, the ultraviolet radiation is directed across the axis of the molecular beam. Though there are many other arrangements that can be used in special cases, this is the one that usually works best in R2PI spectroscopy. If we expose the molecules to ultraviolet photons with a short enough wavelength, these photons have enough energy to ionize the molecules in the beam by a one-photon ionization process. This doesn't give us much physical information about the molecule, but it does help us identify which molecules are in the molecule beam. It also allows me an opportunity to describe the TOF mass spectrometer.
If we use a deep ultraviolet laser photon, a large number of ions are produced every time the laser fires. The ions are produced in a static electrostatic field, which accelerates them to a specific kinetic energy. Since the kinetic energy is equal to mv2/2, a correlation between velocity and mass is produced, with lighter ions traveling more rapidly than heavier ones. We detect the ions at the end of a flight tube with a microchannel plate ion detector, and the time between ion production and detection can be converted into mass. By measuring the signal coming out of the detector every 4 ns, we are able to record an entire mass spectrum on each experimental cycle. In this way we can tell what was produced in our source chamber, no matter how complicated the plasma reactions are that lead to the observed products.
Once we have identified what molecules are in the molecular beam, we increase the wavelength of the ultraviolet laser so that no ions are produced by the excimer laser alone. The key to obtaining an optical spectrum is to use photons with an energy that is less than that required to ionize the molecule. The tunable laser pulse is then used to excite the molecule to an excited electronic state. The subsequent ultraviolet laser pulse, with sufficient energy to ionize the excited state but not the ground state, is fired just a few nanoseconds after the first laser. As the first laser is scanned, no ion signal is detected at the mass of interest until a resonant transition is found. When molecules absorb a photon from the first laser beam, exciting them to an excited electronic state, absorption of a photon from the second laser beam then ionizes the molecule. By monitoring the ion signal at a particular mass as the first laser is scanned in wavelength, an absorption spectrum that is specific to that mass may be recorded. Moreover, by simultaneously monitoring the ion signal at several masses, it is possible to record the spectra of several different molecules at the same time. In fact, it is even possible to separately record the spectra of several different isotopic modifications of a given molecule in the same scan.
Given the fact that our source produces a wide variety of chemical species, it is crucial to be able to identify the molecule that is responsible for a given spectroscopic transition. This has proven especially useful in studies we have conducted in which chromium is vaporized in a stream of helium containing 3% CH4. In the same general spectral region, we have been able to identify spectroscopic transitions in CrH, CrC, CrCH, CrCH2, CrCH3, CrC2H, and CrC3H2, all with absolute certainty as to the mass of the absorbing molecule. This is a powerful advantage that the R2PI method enjoys compared to other spectroscopic techniques.
The spectra obtained with the R2PI instrument allow one to locate excited electronic states and measure their vibrational frequencies and anharmonicities. When rotationally resolved spectra are obtained, it is also possible to deduce bond lengths, bond angles, and often the electronic symmetry of the upper and lower states. It is not generally possible to measure the vibrational levels of the ground electronic state, however, since usually only v=0 and possibly v=1 are populated in the supersonic expansion. It is also difficult to probe excited electronic states lying less than 9000 cm-1 above the ground electronic state, because it is difficult to generate photons with tunable frequencies lower than 9000 cm-1. These limitations led us to construct a second instrument, which builds upon the information obtained from the R2PI instrument.
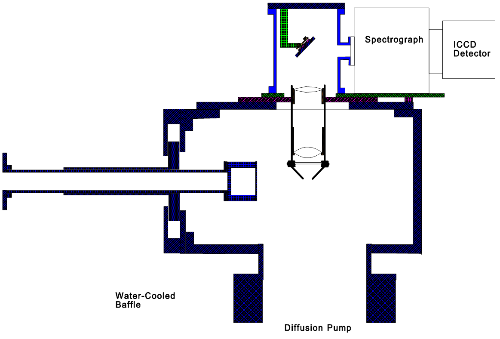
Dispersed Fluorescent (DF) Spectrometer
To complement the capabilities of the R2PI spectrometer we have built a dispersed fluorescence (DF) spectrometer. In this instrument, the molecules entrained in the supersonic expansion are crossed with a tunable dye laser beam, and any fluorescence which is emitted is collected with a system of lenses and sent into a spectrograph. Within the spectrograph, the collected light strikes a diffraction grating and is dispersed into its wavelengths, with different wavelengths being brought to a focus at different positions on a CCD (charge-coupled device) detector array. The CCD allows signals to be integrated over a long period of time and then sent to a computer for storage and analysis.
Once a transition in a molecule of interest has been identified on the R2PI spectrometer, the sample may be brought over to the DF spectrometer so that the fluorescence from the initially pumped level may be examined. Since the molecules are isolated from collisions in a molecular beam, no collisional deactivation is possible, and all fluorescence originates from the initially pumped level. Fluorescence to the various vibrational levels of the ground state occurs at different wavelengths, and measurement of these emitted wavelengths allows the vibrational levels of the ground state to be deduced. Moreover, if low-lying excited electronic states are present, fluorescence to these states allows them to be located and their vibrational levels to be measured as well. Unlike the R2PI spectroscopic method, it is not as obvious which molecule gives rise to a particular fluorescence signal, and this is why both machines are crucial to a full understanding of a new molecule.
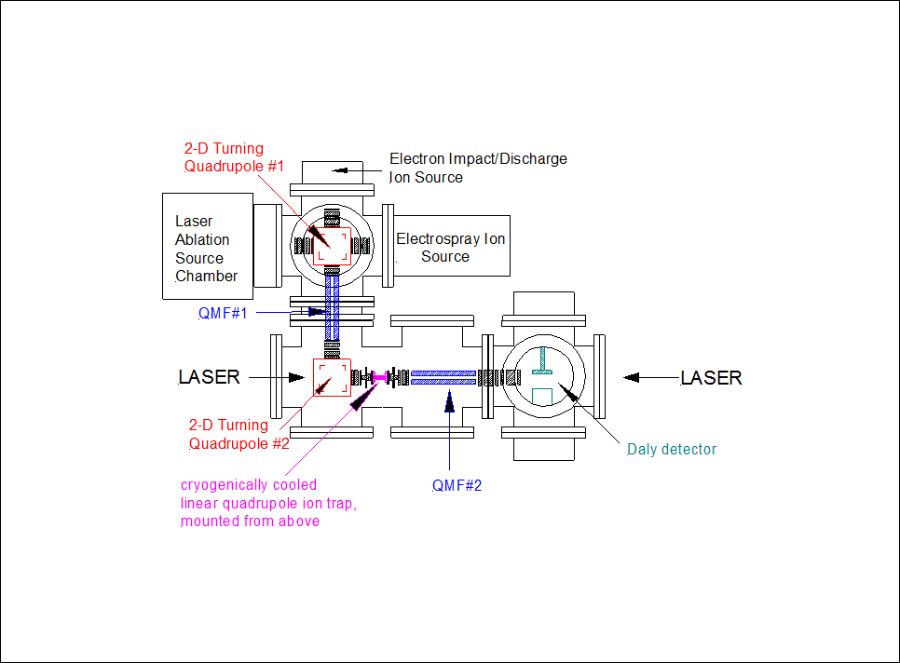
Cryo-cooled Ion Photodissociation Spectrometer
The cryo-cooled ion photodissociation spectrometer, which is currently under construction, will use an ion source, which could be a laser-ablation metal cluster ion source, an electron-impact ion source, or an electrospray ion source. Ions produced in the source will be mass-selected with a quadrupole mass filter and trapped in a radio-frequency ion trap that is mounted on a cold head that can be cooled to temperatures below 5K. A low pressure of helium will be present in the trap, and the helium atoms will be cooled to low temperatures by collisions with the cold metal walls of the trap. Subsequent collisions between the cold helium atoms and the trapped ions will cool the ions to low temperatures. We anticipate being able to rotationally cool ions to temperatures below 20K.
At this point, the trapped ions are irradiated with laser light, and if the light is absorbed and the ion dissociates, a plot of fragment ion signal as a function of laser wavelength provides the spectrum. In the instrument, the ions are given about 2 ms to fall apart, and then they are released from the trap into a second quadrupole mass filter. The quadrupole is set to transmit ions at the mass of the fragment to a Daly detector, which is a specialized detector that counts individual ions. Using a 22 pole trap, we have been able to trap at least 30,000 ions – far more than needed for an experiment. I anticipate that we will be able to use this device to study a very large number of small molecules that have never been studied previously. These include small metal-ligand complexes such as M +×CO, M +×H2O, M +×NH3, M + × H2C=CH2 , and M + × HCºCH, all of which are of relevance to catalysis. I also plan to study small metal clusters such as Cr2+, Cr3+, Ti2+, Cu2+, Cu3+, etc. The number of molecules waiting to be studied with this new instrument is vast, and entirely new families of molecules will be accessible for study when the instrument is completed.
New Molecules
Over the past several years we have published the first spectroscopic observations of a large number of molecules. There is nothing I like better than to be able to write up a definitive report of a new molecule which was previously unknown, and to provide details such as the nature of the ground and excited electronic states, including bond lengths, vibrational frequencies, bond dissociation energies, and electronic state symmetries. It is very exciting to be the first person in the world to learn anything about a new molecule, and then to be able to provide a detailed understanding of how the molecule is held together. The following molecules represent species for which our group provided the first spectroscopic identification in the gas phase:
Coinage Group Dimers: CuAg, CuAu, and AgAu
Nickel Group Dimers: NiPd, NiPt, PdPt, and Pt2
Mixed Nickel-Coinage Group Dimers: NiCu, NiAu, and PtCu
Transition Metal Aluminides: AlCa, AlV, AlCr, AlMn, AlCo, AlNi, AlCu, AlZn, and AlY
Transition Metal Silicides: NiSi, RuSi, PdSi, OsSi, and IrSi
Transition Metal Carbides: VC, CrC, NiC, MoC, PdC, TaC, WC, and OsC
Mixed Early-Late Transition Metal Dimers: ScCo, TiCo, YCo, ZrCo, ScNi, YPd, and YCu
Multiply-Bonded Transition Metal Dimers: VCr, NbCr, VMo, NbMo, CrW, TiFe, ZrFe
Transition Metal Cations: Co2+, Ti2+, V2+, and Co3+ (bond dissociation energies)
Main Group Metal Dimers: LiCa
Coinage Group Trimers: Cu2Ag, Cu2Au, CuAgAu, Ag2Au, and Au3
Main Group Trimers: Al3, Si2N, and Bi3
Semiconductor Dimer: GaAs
Unsaturated Transition Metal-Ligand Complexes: CrCCH, CrCH3, NiCCH, NiCH3, CuCCH
First Measurements of Bond Lengths
Of course, the identification of a new molecule is distinctly different than providing useful information about that molecule. Below is a list of some of the useful information we have provided for the first time. I have chosen to list just two parameters, the ground state bond length and the ground state symmetry. These bond lengths may be given as r0 (corresponding to the average bond length in the v=0 vibrational level) or re (corresponding to the bond length at the minimum of the potential energy curve, obtained by extrapolating the average bond lengths of a series of vibrational levels back to the minimum of the potential curve). Here is a list of the bond lengths first measured in my group:
|
|
Transition Metal Aluminides: | |
| r0(CuAg, X 1Σ+) = 2.3735(6) Å | r0(AlCa, X2Π ) = 3.1479(10) Å | |
| r0(CuAu, X 1Σ+) = 2.3302(6) Å | r0(AlV, X0) = 2.620(4) Å | |
| r0(AlMn, X 5Π ) = 2.6384(10) Å | ||
| Nickel Group Dimers: | r0(AlCo, X 3Δ3) = 2.3833(5) Å | |
| r0(Ni2, X0g+ or X0u-) = 2.1545(4) Å | r0(AlNi, X 2Δ5/2) = 2.3211(7) Å | |
| r0(NiPd, X2) = 2.242(5) Å | r0(AlCu, X 1Σ+) = 2.3389(4) Å | |
| r0(NiPt, X0) = 2.208(2) Å | r0(AlZn, X 2Π ) = 2.6957(4) Å | |
| r0(Pt2, X0g+ or X0u-) = 2.3329(4) Å | r0(AlY, X 3Σ0-) = 2.8728(12) Å | |
| Mixed Nickel-Coinage Group Dimers: | Transition Metal Oxide: | |
| r0(NiAu, X2Δ5/2) = 2.351(1) Å | r0(MoO, X 5Π ) = 1.70 Å | |
| r0(PtCu, X2Δ5/2) = 2.3353(8) Å | ||
| r0(NiCu, X2Δ5/2) = 2.2346(5) Å | Linear Triatomic Molecule: | |
| r0(Si-N-Si, X 2Π1/2,g) = 1.6395(14) Å | ||
| Other Transition Metal Dimers: | ||
| re(CrMo, X 1Σ+) = 1.8182(15) Å | Transition Metal Carbides: | |
| re(V2, X 3Σg-(0g+)) = 1.77 | r0(VC, X 2Δ3/2) = 1.6167(3) Å | |
| r0(Ti2, X 3Δ1g) = 1.9422(8) Å | r0(CrC, X 3Σ-) = 1.6188(6) Å | |
| re(YCu, X 1Σ+) = 2.6197(6) Å | r0(NiC, X 1Σ+) = 1.63084(10) Å | |
| r0(VCr, X 2Δ5/2) = 1.7260(11) Å | r0(MoC, X 3Σ-) = 1.68711(19) Å | |
| r0(NbCr, X 2Δ5/2) = 1.8940(3) Å | r0(RuC, X 1Σ+) = 1.6081(1) Å | |
| r0(VMo, X 2Δ5/2) = 1.8766(2) Å | r0(PdC, X 1Σ+) = 1.7124(8) Å | |
| r0(NbMo, X 2Δ5/2) = 2.0081(3) Å | r0(TaC, X 2Σ+) = 1.7490(2) Å | |
| r0(TiCo, X 2Σ+) = 1.8508(4) Å | r0(WC, X 3Δ1) = 1.7143(2) Å | |
| r0(ZrCo, X 2Σ+) = 1.9883(4) Å | r0(OsC, X 3Δ3) = 1.67267(5) Å | |
| r0(CrW, X 1Σ+) = 1.8814(4) Å | ||
| r0(ZrFe, X 1Σ+) = 1.8768(2) Å | Transition Metal Silicides: | |
| r0(TiFe, X 1Σ+) = 1.7024(3) Å | r0(NiSi, X 1Σ+) = 2.032(3) Å | |
| r0(ScCo, X 1Σ+) = 1.8121(10) Å | r0(RuSi, X 3Δ3) = 2.0921(4) Å | |
| r0(YCo, X 1Σ+) = 1.9830(8) Å | r0(PdSi, X 1Σ+) = 2.0824(3) Å | |
| re(OsSi, X 3Σ-(0+)) = 2.1201(27) Å | ||
| Main Group Dimers: | r0(IrSi, X 2Δ5/2) = 2.0899(1) Å | |
| r0(GaAs, X 3Σg-) = 2.53(2) Å | r0(PtSi, X 1Σ+) = 2.0629(2) Å | |
| re(Al2, X 3Πu) = 2.701(2) Å | ||
| Actinide Nitride: | ||
| r0(UN, X3.5) = 1.7650(12) Å |