
Size-Selected Electrochemistry
See links to recent presentations below, and the publication list for more information
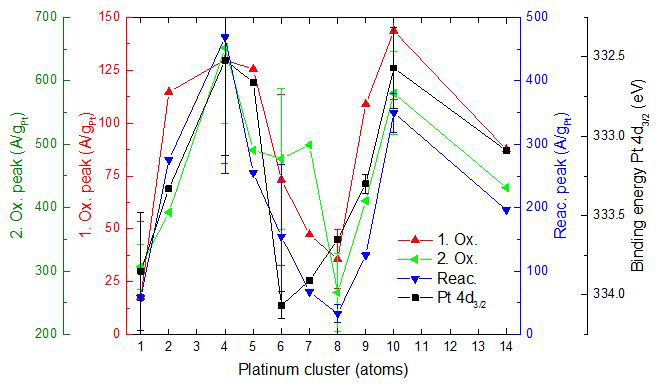
Example: Activity for electrochemical ethanol oxidation in acid electrolyte, for electrodes containing size-selected Ptn clusters. Also shown is the binding energy of the Pt 3d core level. Note that activity is anti-correlated with the core level energy, demonstrating that electronic properties are most important in controlling activity in this case.
Size-selected electrochemistry
Recent presentations:
Keynote at the 227th Electrochemical Society Meeting (Chicago, May 2015)
Single Trapped Nanoparticles
This new project has a number of goals:
1. Continuing development of nanoparticle mass spectrometry (NPMS) as a tool for nanoparticle characterization.
2. Use of NPMS to probe the optical properties of fluorescence nanoparticles, such as semiconductor quantum dots.
3. Development of NPMS-based tools to study surface chemistry on individual nanoparticles at high temperatures.
4. Use of NPMS for high precision mass spectrometry of biological nanoparticles such as viruses.
NPMS is based on trapping individual nanoparticles (NPs) in a quadrupole trap, and measuring the frequency, ωz, of their oscillatory �secular� motion, from which the mass/charge ratio, M/Q, can be calculated.� , where V0 and Ω are the amplitude and frequency of the radio-frequency trapping voltage applied to the trap, and z0 is a characteristic dimension of the trap.
Our current instrument is shown in the figure. To introduce NPs into the trap, we use an electrospray source, which has proved to be efficient for introduction of all different types of NPs in mass ranges from 200 kiloDalton (kDa) to > 3 gigaDalton (GDa), corresponding to diameters from a few to a few hundred nanometers. �NPs are pre-filtered by a linear quadrupole guide/trap which rejects molecular ions or NPs with M/Q outside the desired range.� Once trapped, the NP is detected optically, using light scattering for large particles, and laser-induced fluorescence (LIF) for small particles, with light detected by an avalanche photodiode/multichannel scalar system.� The instrument is also equipped with a cw CO2 laser that can be used to heat particles for cleaning or to drive surface chemistry.� If the particles are hot enough, then thermal photon emission can also be used as a detection method.
High precision NP mass measurements: The best previous mass precision for NPMS was 100 ppm in a single measurement, improved to ~10 ppm by an hour of averaging. The figure to the left shows two scans for a single NP, measuring the frequency associated with secular oscillation in the axial direction (ωz). The step inflection points of the two scans (=ωz) agree to within ~0.8 ppm, and the long term M/Q repeatability (i.e., the precision) is ~2 ppm. To determine Q, and hence M, we measure the steps in ωz that occur when the NP changes charge by a single electron (see below).� For the NP in the figure, Δωz was 0.379937 Hz/electron, and the NP mass was, therefore, 5.944639 � 0.000047 fg, or 3.580030 GDa.� The left inset in the figure shows a small Coulomb crystal formed by an ensemble of NPs initially injected into the trap.� This ensemble was subsequently selectively reduced to yield a single NP in the trap (right inset). �In this case, the NPs are ~200 nm in diameter, allowing detection and imaging by light scattering.
Optical properties of quantum dots:� Most of our work has focused on measuring optical properties of semiconductor quantum dots (QDs) and small aggregates of QDs. QDs (<10nm dia) are detected using LIF.� We are able to selectively inject, detect, mass analyze, and manipulate single QDs, and also single NPs composed of a few aggregated QDs .� NPs can be studied for many hours, as they are heated, reacted, and probed by lifetime and spectral measurements. Single QDs: Example data for a single QD is shown in the figure.� Conditions were optimized for rapid ωz determination (Ptrap = 10-3 Torr of argon, fast ωz scan rate) giving M/Q with ~0.2% precision every ~10 sec. The inset shows a fast ωz scan, where ωz appears as a peak due to collisional damping from the argon buffer gas.� If needed, periodic slow scans can be made to obtain higher precision, although for small particles like QDs, moderate precision is often sufficient. The main figure shows how the secular frequency, ωz, changes with time.� Note the quantized steps, due to changes in charge (integers next to each step), resulting from collisions with electrons, Ar+, or Ar* created by a discharge. The step size allows determination of Q, and therefore M, which is also plotted as a function of time.� This QD had a starting mass of 572 kDa, in the middle of the nominal mass range for the QDs used (7 nm +/- 10% diameter� =~ 370 - 680 kDa). This mass does not include the estimated ~140 kDa of ligands, however, this QD was first heated via CO2 laser, and evidence suggests that much of the ligand mass is lost in the process. In this example, we see slow mass loss due to heating by the LIF laser. Note also that during the initial few minutes, while Q = 16, there was a factor of ~2 decrease in LIF intensity, which stabilized as soon as the step to Q=15 occurred.� One goal of the proposed work is to understand these correlations between properties such as M, Q, and surface chemistry, and fluorescence intensity and lifetime.
QD Aggregates: Some of our most interesting results have been obtained for small aggregates of QDs. This figure gives an example, where a single NP, containing two photoactive QDs, was studied for ~3 hours at low LIF laser intensity, during which time it underwent a number of behavior changes.� The main figure shows intensity vs. time, with both 1 sec (green) and 100 msec (black) time binning. After an initial period where the intensity dropped, the NP settled into a stable period of blinking (intermittent fluorescence), starting at ~1800 sec., and running until ~6000 sec. Inset A shows 30 sec of typical blinking, and Inset B shows a histogram of intensities over the 2000-6000 sec time range.� Note that despite there being two active emitters, the intensity is strongly bimodal, suggesting that emission from the two QDs is correlated, such that they are either both bright or both dark during this time period.� Although the behavior is broadly stable between 1800 and 6000 sec, the emitters are actually changing slowly, as shown by the changes in the distributions of time spent in the �On� and �Off� states.� Initially, the On and Off time distributions (Inset C) are quite similar, and both depart from power law dependence. �Late in the blinking record (Inset D), the probability of long On intervals increases, and the probability of long Off intervals decreases, i.e., the duty factor increases substantially with time.� At ~6500 seconds, blinking continues, but the brightness of the �Off� state increases to ~half the �On� brightness, indicating that one of the QDs is �stuck On� continuously. Just before 8000 seconds, the brightness begins to decrease, suggesting that the quantum yield for one or both QDs is dropping, and then at ~8000 and ~8500 seconds there are two abrupt transitions dropping the intensity to baseline, indicating that first one, and then the other QD bleached.� We are in the process of collecting additional aggregate time records, in order to assemble a statistically meaningful picture of the range of photophysical behavior they can exhibit.�
Heating/oxidation effects: We also have studied the effects of heating QDs in both inert and oxidizing environments.� This figure shows an example of the behavior for a small aggregate containing 3 to 4 QDs which was trapped and briefly exposed to the CO2 laser at time < 0 to desorb ligands. LIF was pumped by a cw 532 nm laser at moderate power, resulting in significant heating. The ωz trace shows the charge stepping needed to establish Q, and the �Mass� trace indicates shows mass loss by sublimation from the hot particle.� At ~70 min, the Ar buffer was replaced with 10-3 Torr of O2, and it can be seen that the rate of mass loss increased, suggesting oxidative volatilization.� During this rapid mass loss, the emission intensity nearly doubled. At ~125 min, the rate of mass loss abruptly slowed, and at this point there was a sudden ~50% decrease in LIF intensity. The conclusion is that surface chemistry has a major effect on emission, suggesting that emission is from trap states associated with the surface. After tracking the oxidized NP for an hour, we hit it with the CO2 laser (~5 kW/cm2) for 2 minutes, and the LIF brightened substantially, even though there was no obvious mass change, again suggesting that subtle changes in surface chemistry strongly affect fluorescence quantum yield.
Nanoparticle Fuel Additives
Issues relating to nanoparticulate fuel additives
The goal is to design and produce nanoparticle additives for jet/rocket fuels and pyrotechnic solids, that significantly increase the energy density, while maintaining or improving combustion rates. Applications range from hypersonic flight to long duration/micro satellite propulsion. There are a number of tough issues that all must be addressed to make this happen. We are aiming for a simple and inexpensive synthesis method for nanoparticles that will simultaneously address the following issues:
1. High Energy Density
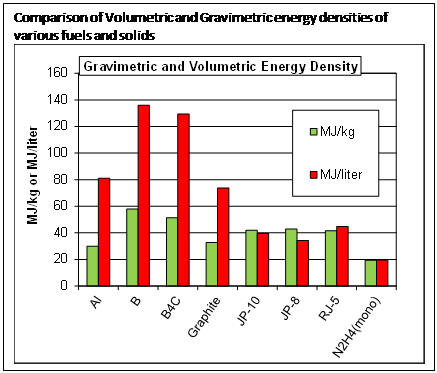
The goal is to load liquid or solid fuels with solid particles that add significantly to the energy density. The figure compares the energy density of typical hydrocarbon fuels and hydrazine (rocket fuel), with some potential solid fuel additives. Note that aluminum has significantly increased energy/volume, but lower energy/mass compared to hydrocarbons. Boron and boron-rich solids are significantly better than hydrocarbons on both volume and mass bases. We are working on both aluminum and boron nanoparticles, because each has advantages for different applications. In the following, I will use the term metal to refer to both aluminum and boron, a semi-metal.
2. Heterogeneous kinetics
Hydrocarbons burn by vaporizing, mixing with oxidizer, and then burning in the gas phase. Boron is refractory, and even aluminum has a vaporization temperature >2000K. Therefore, reaction rates will tend to be limited by diffusion to and from the metal particle surfaces. To make this rate as fast as possible, it is important to disperse the metal as nanoparticles, and to somehow keep the particles dispersed as the fuel/nanoparticle mixture burns
3. Native oxide passivation
One major problem with combustion of both boron and aluminum (most metals, in fact) is that the metal surfaces are passivated by a native oxide layer a few nanometers thick. This oxide greatly retards ignition of the metal. In addition, if the particle size is reduced into the nanoscale, the oxide (which is just dead weight) becomes a larger and larger fraction of the total mass, with corresponding reduction in energy density. Particles can easily be generated without an oxide coating, however, if they are not protected somehow, they ignite (sometimes explosively) upon contact with air.
4. Air-stable, un-oxidized nanoparticles
For obvious reasons, most applications require that fuel be stable in contact with air, during storage, etc. Therefore, one of our goals is to generate particles that are un-oxidized, yet air stable.
5. High solubility/dispersibility in fuels, solid propellants.
For liquid fuels, we want our additives to be highly soluble (i.e., forming stable, high density suspensions) in the fuel. For solid propellants or pyrotechnics, the issue is mixability the ability to load large densities of nanoparticles into the binder. In both cases, the problem requires that the surface free energy of the particles in contact with the fuel or binder be as low as possible. This is done by controlling the nanoparticle surface chemistry.
6. Ignition catalysts
Another idea we have demonstrated, is the ability to coat the surface of the nanoparticles with patches of a combustion catalyst or ignition aid. For example, we have generated fuel-soluble boron nanoparticles that have a partial coating of CeO2.
7. Cost and scalability
There are many elegant gas-phase and solution-phase nanoparticle synthesis methods, giving great control over particle size, surface chemistry, etc. The problem is that they tend to use expensive reagents, and/or complex processing. We have focused on single step, single pot synthesis methods based on ball milling, which is a cheap and readily scalable method. The trick is to pick the right conditions, including capping agents, to generate particles in the desired size range with the desired surface chemistry. The starting materials are simply the bulk metal, plus capping agents and dispersing agents, all of which are inexpensive. Even laboratory scale mills can produce many grams/day.
8. Combustion and other properties
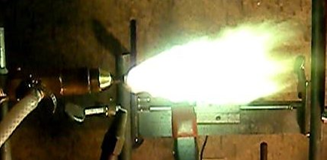
You have to test these things, and we collaborate with a number of groups at the Naval Research Lab, University of Hawaii, University of Alabama, and Purdue University, and have provided particle-loaded fuels for tests ranging up to operation in a 14 HP turbine engine. In addition, we have developed a turbulent flame calorimeter capable of accurately measuring total power output from flames such as the boron-loaded flame shown in the figure (flame is about 8 long). We also make extensive use of analytical tools such as scanning transmission electron microscopy (STEM), scanning electron microscopy (SEM), dynamic light scattering (DLS), X‑ray photoelectron spectroscopy (XPS), NMR, and FT-IR spectroscopy to understand the nature of the particle surfaces.
Recent Results
Un-oxidized, air-stable, catalyst-coated boron nanoparticles
Un-oxidized fuel/propellant soluble Al nanoparticles
Details on boron:
1. Van Devener, B., Perez, J. P. L., Anderson, S. L., Air-stable, Unoxidized, Fuel-Soluble Boron Nanoparticles
Journal of Materials Research, 2009. 24 p. 3462-3464.
2. Van Devener, B., et al., Oxide-Free, Catalyst-Coated, Fuel-Soluble, Air-Stable Boron Nanopowder as Combined Combustion Catalyst and High Energy Density Fuel. Energy and Fuels, 2009. 23: p. 6111-6120
Visualizing Molecules with gOpenMol
gOpenMol is a molecular visualization program written by Leif Laaksonen and available from him at www.csc.fi/gopenmol/ . Versions are available for Windows, Linux, and some Unix platforms.
This tutorial was written by Scott Anderson and applies to both the Win 95/98/NT..., Linux, and UNIX versions of gOpenMol. The tutorial is not intended to be a manual, but rather a simple walk-through showing how to accomplish some of the more common types of visualization. The examples are all from Gaussian 98, however, gOpenMol can be used with a very large variety of quantum chemistry/molecular mechanics programs. The tutorial covers:
1. Installing and running gOpenMol on Windows and some Linux hints
2. Importing and viewing calculated molecular structures in various ways
3. Visualizing molecular orbitals, electron densities, spin densities, etc. in several different ways
4. Viewing Vibrations or other trajectory information:
A. Animations
B. Vibrations as static vectors
C. Analyzing Trajectories
5. Making movies
6. Selecting and manipulating groups of atoms, measuring molecules, merging structures and exporting structures
7. Global v.s. Local transformations
8. Automating with scripts
9. Features for Biomolecule Visualization
10. Creating VRML files (3D images and trajectories that can be manipulated over the web)
11. Customization and other stuff I thought was useful/cool
The first example image shows the shape of the total electron density for a molecule thought to be an intermediate in decomposition of methyl cubane. The second image shows a vibration of the phenol cation - ammonia complex that is found experimentally to substantially enhance the cross section for H atom exchange in reaction of state-selected PhOH cation with ammonia.
Download Tutorial.zip The zip file contains sample files used in the tutorial, however, you can just as easily substitute your own files.
Download just the stand-alone xvibs utility
Return to Scott Anderson's home page
The Utah RF Generator Page
There are two versions of the rf generator. The more complex version was described in "A Simple Radio-Frequency Power Source for Ion Guides and Traps", Ronald M. Jones, Dieter Gerlich, and Scott L. Anderson, Rev. Sci. Instrum. 68 (1997) 3357-62. You can download the original article here and you can find more detailed construction information here.
This more complex version includes ability to add DC offsets (useful in calibrating the rf effective potential), and also a high speed keying circuit that can ramp the rf up and down. This keying circuit adds substantially to the complexity, and 99% of applications don't need it.
We also published the design for a much simpler version of the the rf generator: "Simplified Radio-Frequency Generator for Driving Ion Guides, Traps and other Capacitive Loads", Ronald M. Jones and Scott L. Anderson, Rev. Sci. Instrum. 71 (2000) 4335-7, which can be downloaded here. This version does not have the capability for DC offsets (though you can easily add that part of the circuit from the more complex design, and also uses fixed capacitors instead of the expensive air-variable capacitors. You give up the ability to fine tune the rf frequency, but for most applications, who cares?
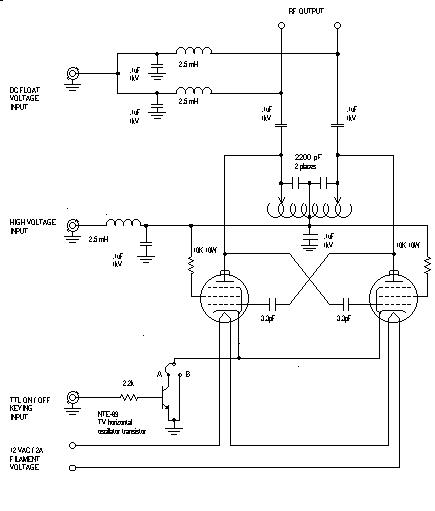
IMPORTANT
For both the complex and simplified versions of the rf generator, we have found it useful to make a change in the design of the tank circuit, as shown below for the simplified version. The imporant change is that the single capacitor (Ctune) used to set the frequency of the tank circuit has been replaced by a pair in series, with the center tap grounded. This design improves stability of the oscillator, and allows it to operate over a much wider frequency range. In my lab, we currently have versions running at frequencies from a few hundred kHz to 10 MHz.
Size-Selected Cluster Deposition and Model Catalyst Studies
The problem:
Many important catalysts consist of small clusters or nanoparticles of active metals or metal oxides, dispersed on a high surface area support (e.g. titania, alumina, silica). These catalysts are complex and difficult to study, therefore many groups have turned to planar model catalysts where catalytic clusters/nanoparticles are grown on a single crystal or thin film support, allowing them to be studied by surface science methods like STM, ion scattering, electron spectroscopies, and a variety of mass spectrometry methods. In such experiments, there is still a rather broad range of cluster/nanoparticle sizes present, as well as distributions of metal-support geometries. In our experiments, we grow catalytic cluster ions in the gas phase, then use a mass spectrometer to select a particular size/composition of interest, which is then deposited on a single crystal support to make a truly monodisperse model catalyst. We then use a variety of in situ methods to characterize morphology, electronic structure, adsorbate binding, and catalytic activity. Typical results are summarized in the PDF files linked below.
Funding AFOSR and DOE
Recent Results: (Note: the slide shows may be too big if you have a slow internet connection).
CO oxidation over Pd/TiO2 - correlations of activity with electronic structure and adsorbate binding